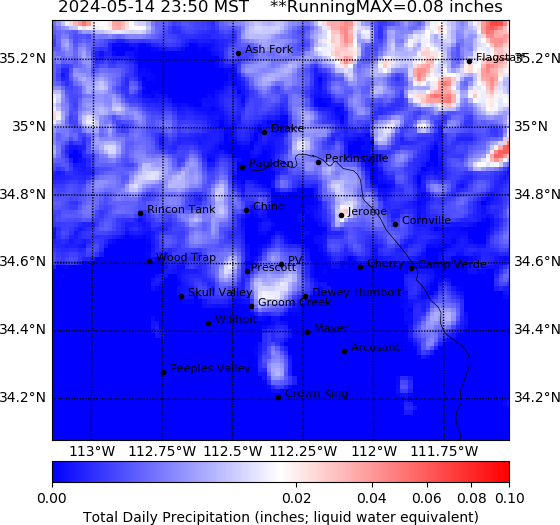
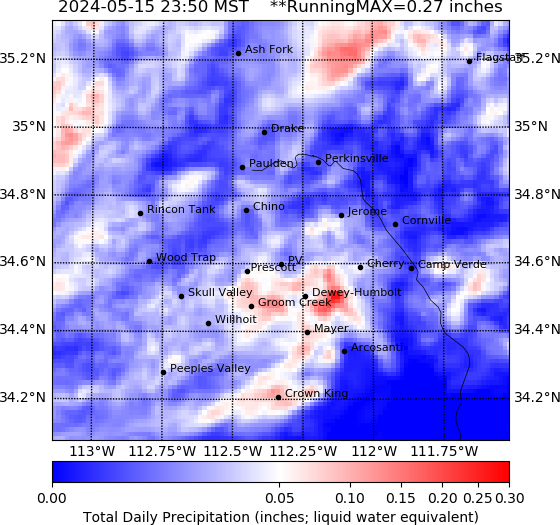
(In case you're wondering why everyone seemed to get rain except you...)
Top Row: Total 24-hour total
precipitation for today and tomorrow.
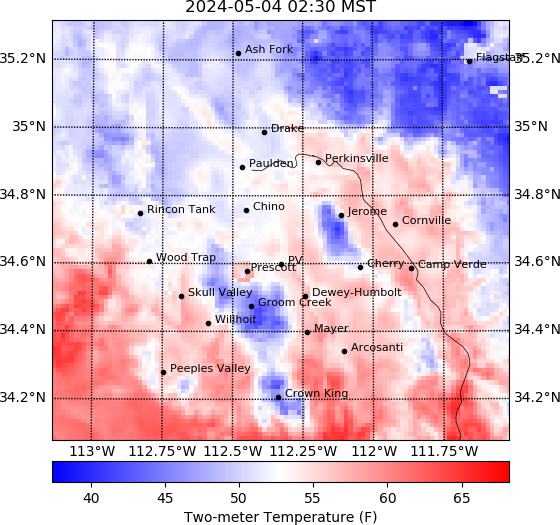
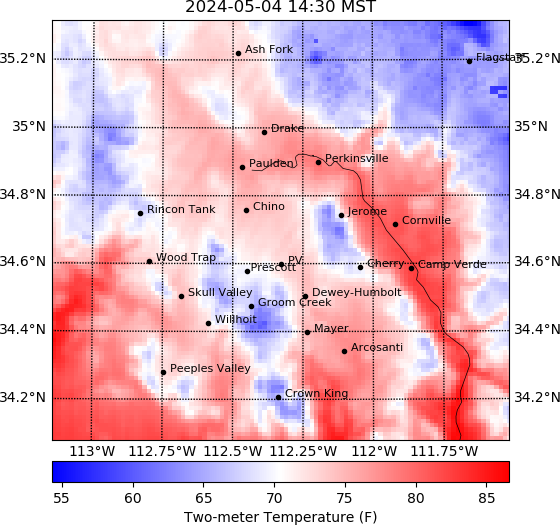
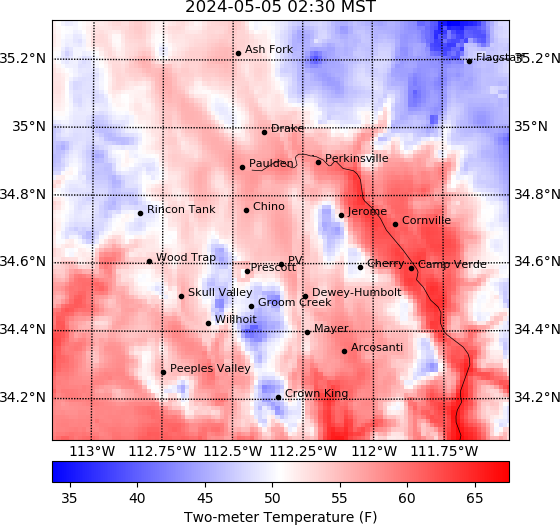
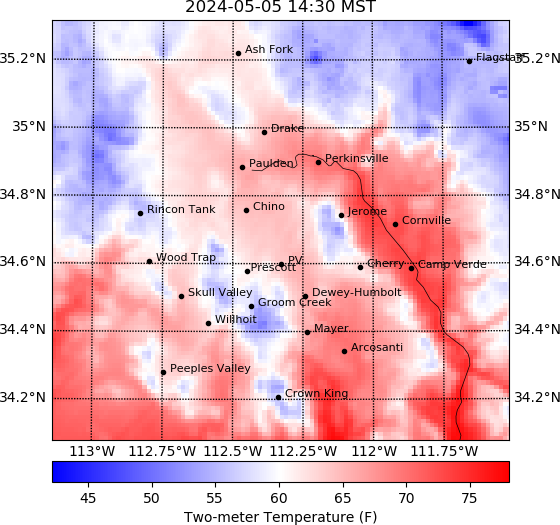
Also, Min/Max temperature: Today and Tomorrow
Also, Min/Max temperature: Today and Tomorrow
Lower Rows: Time-Stamped,
Adjustable MOVIES
(for today and tomorrow)
Use video controls to view specific
times on videos.
The videos each cover 2 days. (Videos have a green border)
SEE YESTERDAY's WEATHER FORECAST
Please send additional data requests to: wm[at]yavapaiweathertracks.org
| Precipitation |
Relative
Humidity |
Temperature |
| Total
Sunlight |
Wind
Speed |
Max
Wind Gust |
| RADAR |
Total
Cloud |
HAIL and SNOWFALL |
The videos each cover 2 days. (Videos have a green border)
SEE YESTERDAY's WEATHER FORECAST
Please send additional data requests to: wm[at]yavapaiweathertracks.org
YAVAPAIWEATHERTRACKS.ORG
These are high-resolution numerical weather prediction models of the next two days, using inputs from the NOAA North American Mesoscale Forecast Data, starting at midnight local time each day; these change on a day-to-day basis because, well, weather is often chaotic. These are at 4 times the resolution of US National Forecasts, and more accurately resolve local effects of Yavapai County's terrain. Same-day forecasts are the most likely to be accurate, but, of course, weather forecasting is never guaranteed.
On hot days, forecast isolated pockets of rain often do not reach the ground.
(To start all the videos over at the same time, just refresh the page)
See how forecasts change day-to-day - look at Yesterday's Forecast
Wind-Gust and Squall Line 2022-10-03
Rather than providing coarse predictions tied to specific locations, this site provides highly-detailed 2-dimensional data over the entire region, at a temporal resolution of 10 minutes, in the form of data movies. The data in the movies can be "surfed" for specific times-of-day and locations by using the slider which appears when the mouse cursor is placed over the movie. Daily 2:30AM and 2:30PM snapshot maps of surface air temperature as well as daily total precipitation snapshots are also provided at the top of the page, for quick reference. When using these forecasts, be aware that these are best-estimates made from NAM data acquired shortly after midnight local time, and are therefore subject to change, especially the predictions for the second-day weather. As with all weather forecasts, the downside of very-high-resolution data is that it can accrue error from small changes which may occur after the daily NWS NAM forecast data is downloaded to run our high-resolution forecasts.
(to see when storms will happen, look at the movies, below)
TWO DAY MOVIES: (below)
Home
Home
Home
Home
Home
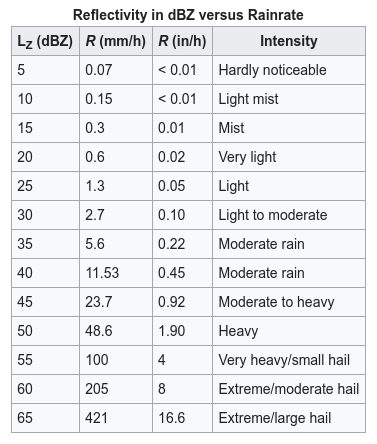
dBZ on Wikipedia...
Note: dBZ greater than 50 may indicate HAIL
(see HAIL Rate)
Home
Home